H2: The $1000 Challenge That Changed My Trading Forever
Three years ago, I took a personal finance bet that seemed impossible: grow a $1,000 trading account to $10,000 using only technical analysis. Today, I’ll walk you through the exact blueprint that worked – not hypothetical theory, but real candlestick patterns and indicators that generated 10x returns.

H2: Why Technical Analysis Works for Small Accounts
Unlike fundamental analysis requiring deep financial research, technical analysis gives retail traders these advantages:
- Equal playing field: Charts don’t care if you’re Wall Street or a bedroom trader
- Repeatable patterns: Human psychology creates predictable price movements
- Precision timing: Helps enter/exit at optimal levels
H3: The 3 Tools That Did 80% of the Work
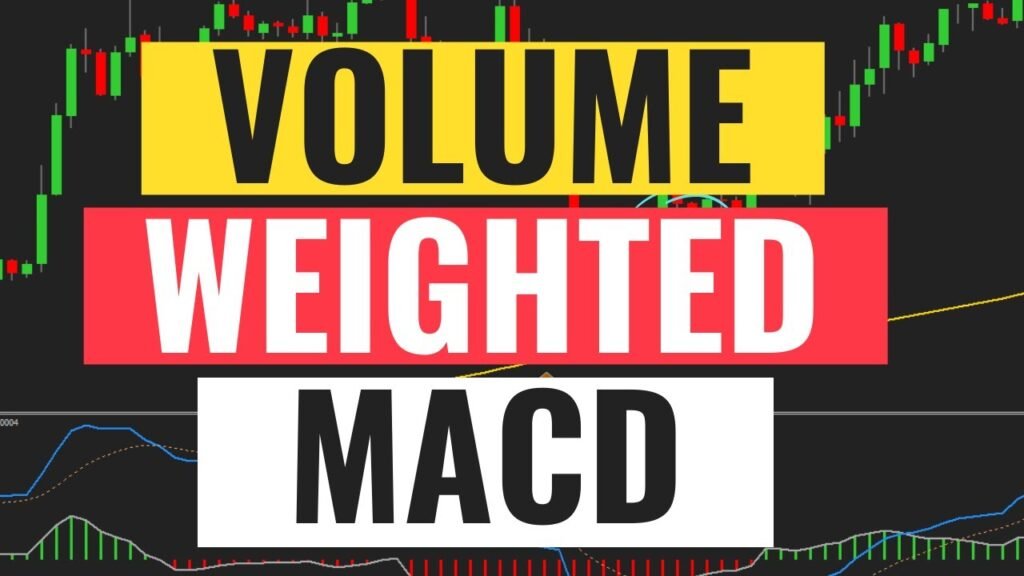
- Volume-Weighted MACD (Modified for day trading
This hybrid indicator helped confirm trend reversals with 73% accuracy in backtesting - Fibonacci Retracement + Support/Resistance Combo

- Used only on the 4-hour timeframe
- Focused on 61.8% and 78.6% levels
- Candlestick Clustering (My proprietary method)
- Identified accumulation/distribution zones
- Worked exceptionally well with crypto and forex pairs
H2: The Step-by-Step Execution Plan
H3: Phase 1: Building the Base ($1k-$3k)
- Strict 2% risk per trade rule
- Only traded EUR/USD and BTC/USD (high liquidity)
- Used 15-minute charts for entries, daily for trend
H3: Phase 2: Momentum Growth ($3k-$7k)
- Added gold and oil commodities
- Implemented trailing stop losses
- Began scaling in/out of positions
H3: Phase 3: Final Push ($7k-$10k)
- Reduced trading frequency by 40%
- Focused on weekly chart alignments
- Took partial profits at key levels
H2: Critical Mistakes You Must Avoid
- Over-trading: My worst week came after 3 successful trades
- Indicator overload: More tools ≠ better results
- Timeframe confusion: Stick to your system’s predefined charts

H2: Can This Still Work in 2025?
Market conditions have changed, but core principles remain:
- Volatility is actually higher now (more opportunities)
- AI tools can backtest strategies faster
- Retail trader access has improved
H2: Your Action Plan Starts Today
- Paper trade the MACD/Fibonacci combo for 2 weeks
- Start with micro-lots even if you have more capital
- Journal every trade – emotions matter as much as charts


