

Navigating the world of cryptocurrency trading can feel overwhelming, especially with the fast-paced markets of 2025. But there’s one tool that every trader, from beginners to pros, relies on: candlestick charts. These charts are like a window into the market’s soul, showing price movements in a way that’s easy to understand—if you know how to read them. In this guide, we’ll break down candlestick charts step by step, so you can start trading with confidence. No jargon, no fluff—just clear, actionable insights for everyday people.
What Are Candlestick Charts?
Candlestick charts are visual representations of price movements over a specific time period, like an hour, day, or week. Each “candlestick” tells a story about how the price of a cryptocurrency, like Bitcoin or Ethereum, moved during that time. They’re called candlesticks because they look like candles with wicks (or shadows) on top and bottom.
Why are they so popular? Because they pack a ton of information into a single glance, helping traders spot trends, reversals, and opportunities. Let’s dive into how they work.

Anatomy of a Candlestick
Every candlestick has four key parts:
- Open: The price at the start of the time period.
- Close: The price at the end of the time period.
- High: The highest price reached during the period.
- Low: The lowest price reached during the period.
The “body” of the candlestick shows the difference between the open and close prices. If the close is higher than the open, the body is usually green (or white), indicating a price increase. If the close is lower, it’s red (or black), showing a price drop. The “wicks” or “shadows” extend above and below the body, marking the high and low prices.

Why Candlestick Charts Matter in Crypto
Crypto markets are volatile, with prices swinging wildly in hours or even minutes. Candlestick charts help you make sense of this chaos by revealing patterns that hint at what’s coming next. Whether you’re day trading or holding long-term, understanding these patterns can give you an edge.
In 2025, with new coins, DeFi projects, and NFT marketplaces popping up daily, staying ahead means knowing when to buy, sell, or hold. Candlesticks are your roadmap.
Timeframes: Choosing the Right One
Candlestick charts can represent different timeframes—1 minute, 1 hour, 1 day, or more. Short timeframes (like 1-minute or 5-minute charts) are great for day traders looking for quick moves. Longer timeframes (like daily or weekly charts) suit investors focused on big-picture trends.
Tip: Start with a 1-hour or 4-hour chart if you’re new. It’s less hectic than minute-by-minute charts but still shows meaningful patterns.
Common Candlestick Patterns to Know
Candlestick patterns are like the market’s secret code. By recognizing them, you can predict whether prices might rise, fall, or stay steady. Here are a few beginner-friendly patterns to get you started.
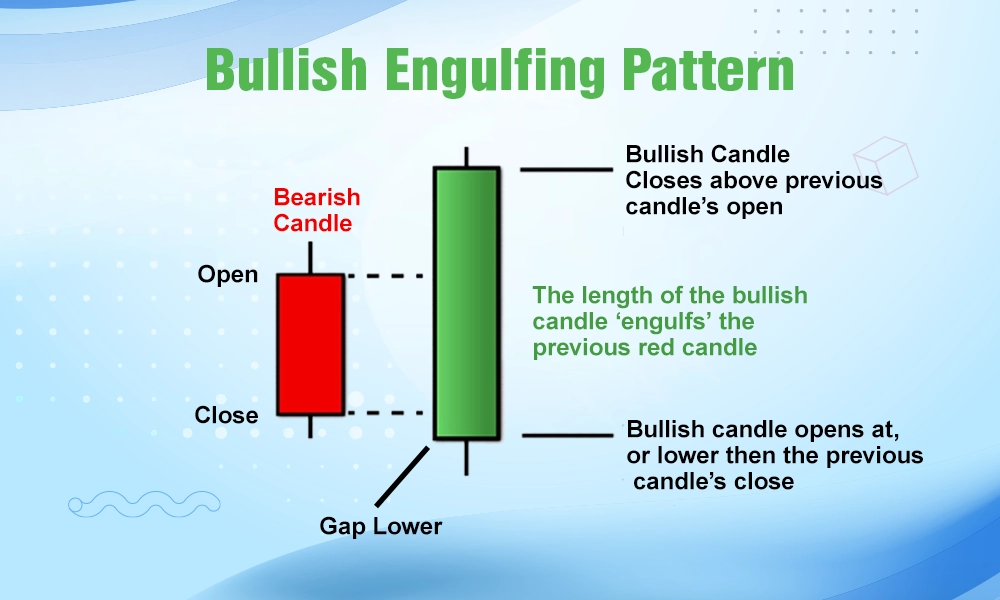
1. Bullish Engulfing
This pattern signals a potential price increase. It happens when a small red candlestick is followed by a larger green one that completely “engulfs” it. It suggests buyers are taking control.
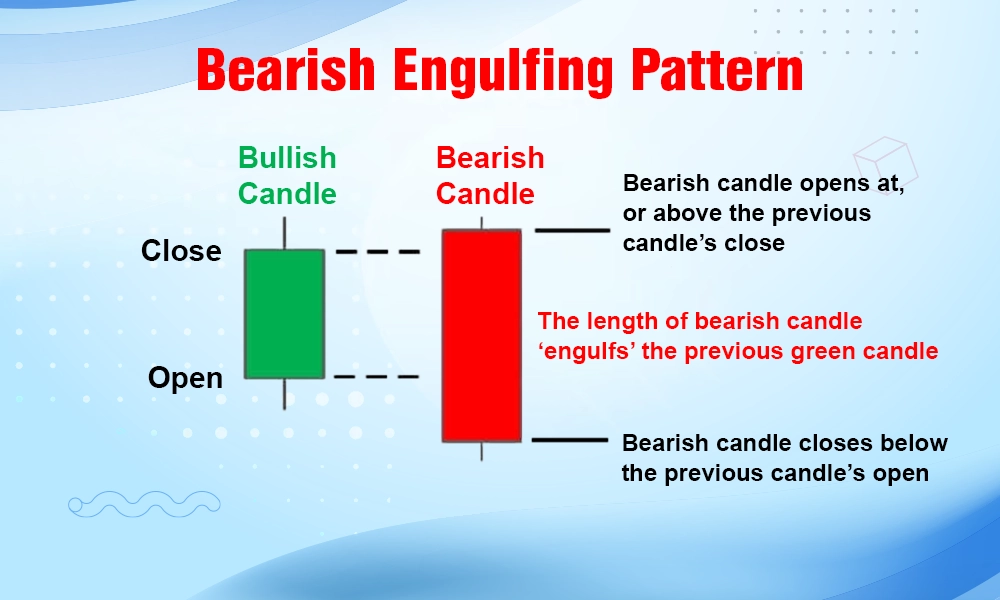
2. Bearish Engulfing
The opposite of bullish engulfing, this pattern hints at a price drop. A small green candlestick is followed by a larger red one, showing sellers are overpowering buyers.
3. Doji
A Doji candlestick has a tiny body, where the open and close prices are very close. It signals indecision in the market and often appears before a big price move. Think of it as the market taking a deep breath before deciding its next step.

How to Read Trends with Candlesticks
Beyond individual patterns, candlesticks help you spot trends—uptrends, downtrends, or sideways markets. Here’s how to read them:
- Uptrend: A series of green candlesticks with higher highs and higher lows. This shows strong buying pressure.
- Downtrend: A series of red candlesticks with lower highs and lower lows. Sellers are in charge.
- Sideways: Candlesticks with no clear direction, bouncing between a high and low price. The market is “range-bound.”

Support and Resistance Levels
Candlesticks also help you identify support (a price level where buyers step in) and resistance (a price level where sellers push back). These levels act like invisible walls, and candlestick patterns near them can signal breakouts or reversals.
For example, a bullish engulfing pattern at a support level might mean it’s time to buy. A bearish engulfing at resistance could be a sell signal.
Practical Tips for Using Candlestick Charts in 2025
Ready to start? Here are some tips to make candlestick charts work for you:
- Use a Reliable Platform: Platforms like TradingView or Binance offer robust charting tools. Make sure your exchange supports customizable candlestick charts.
- Combine with Other Tools: Candlesticks are powerful, but they’re even better with indicators like RSI (Relative Strength Index) or moving averages.
- Practice First: Use a demo account to test your skills without risking real money.
- Stay Updated: Crypto markets evolve fast. Follow news on X or crypto blogs to understand what’s driving price moves.
- Manage Risk: Never invest more than you can afford to lose, and use stop-loss orders to protect your funds.
Common Mistakes to Avoid
Even pros make mistakes, but here’s how you can stay ahead:
- Overtrading: Don’t jump into every pattern you see. Wait for strong signals.
- Ignoring Context: A pattern alone isn’t enough. Check the trend, volume, and news.
- Chasing Hype: In 2025, new coins and trends will spark FOMO. Stick to your strategy.
Conclusion: Start Reading Candlesticks Today
Candlestick charts are your key to unlocking the crypto market’s secrets. By understanding their anatomy, recognizing patterns, and spotting trends, you’ll be well on your way to trading like a pro in 2025. Start small, practice regularly, and always keep learning. The crypto world moves fast, but with candlesticks, you’ll be ready to ride the waves.
Want to dive deeper? Check out platforms like TradingView for hands-on practice, or follow crypto experts on X for real-time insights. Happy trading!


