

2026 Update: What’s Changed?
💡 Read charts like a pro with Binance’s advanced trading interface. Sign up here. Code: CPA_00DF3S8AFA.
Since this guide was originally published, the cryptocurrency market has reached new milestones. Bitcoin surged to new all-time highs above $110,000 in early 2026, while Ethereum’s staking ecosystem continued to grow following successful network upgrades. The total crypto market capitalization now exceeds $5 trillion, reflecting sustained institutional adoption and mainstream acceptance. Spot Bitcoin and Ethereum ETFs have brought traditional investors into the space, while real-time payment systems like FedNow (US) and SEPA Instant (EU) have made buying and selling crypto faster and cheaper than ever before.
Regulatory clarity has also improved significantly. The European Union’s MiCA regulation is now fully in effect, providing a comprehensive legal framework for crypto exchanges, wallet providers, and stablecoin issuers across all 27 member states. In the United States, bipartisan crypto legislation passed in late 2025 clarified the classification of digital assets, distinguishing between securities and commodities. These developments have reduced legal uncertainty, improved consumer protections, and paved the way for broader adoption. As always, staying informed and practicing good security habits remains essential for anyone navigating the crypto space in 2026.
Crypto price charts can look like a jumble of lines and numbers, but they’re your key to understanding market trends for coins like Bitcoin or Ethereum. For beginners, learning to read these charts is like learning a new language — especially in a market known for extreme crypto volatility—it helps you make smarter investment decisions. This tutorial breaks down crypto price charts in simple terms, covering candlesticks, trends, and basic indicators, so you can start confidently in 2025.
Why Learn to Read Crypto Price Charts?
Price charts show how a cryptocurrency’s value changes over time, helping you decide when to buy or sell. They reveal patterns and trends that guide your strategy, whether you’re trading or holding long-term. For beginners, understanding charts:
- Prevents buying at peak prices due to hype.
- Spots good times to buy during dips.
- Builds confidence in volatile markets.
Tip: Practice reading charts on TradingView for free.
Basics of a Crypto Price Chart
Before diving into details, let’s cover the core parts of a crypto price chart you’ll see on platforms like Coinbase or Binance.
1. Price Axis (Y-Axis)
The vertical axis shows the cryptocurrency’s price, usually in USD. It tracks how high or low the price goes.
Example: If Bitcoin’s price is $50,000, the Y-axis marks that level. A spike to $55,000 shows upward movement.
2. Time Axis (X-Axis)
The horizontal axis shows time, from minutes to years. You can adjust the timeframe (e.g., 1-hour, 1-day, 1-month) to see short or long-term trends.
Example: A 1-day chart shows Bitcoin’s price changes over 24 hours, while a 1-year chart shows yearly trends.
3. Chart Types
Charts come in different styles, but two are most common:
- Line Chart: A simple line connecting price points over time, good for quick trends.
- Candlestick Chart: Shows detailed price movements (open, close, high, low) for each time period, ideal for analysis.
Tip: Start with candlestick charts on TradingView for deeper insights.
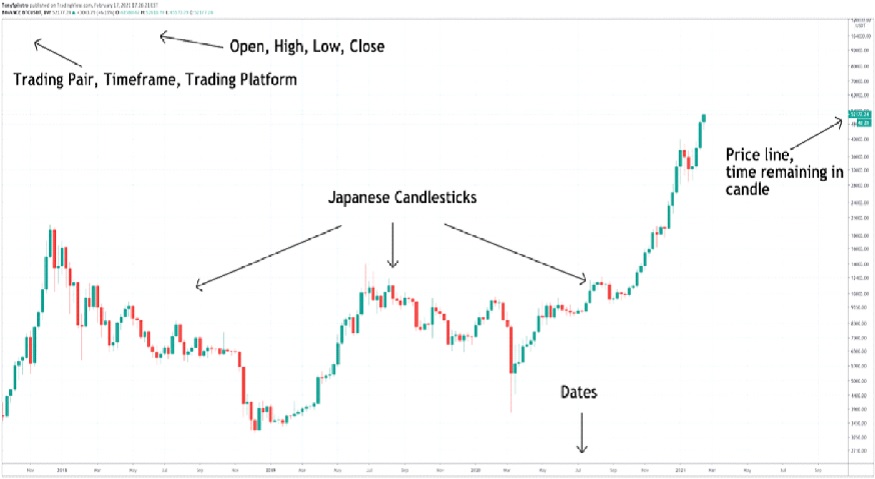
Understanding Candlestick Charts
Candlestick charts are the most popular for crypto because they pack a lot of info into each “candle.” Here’s how to read them.
1. Anatomy of a Candlestick
Each candlestick represents a time period (e.g., 1 hour, 1 day) and shows four prices:
- Open: The price at the start of the period.
- Close: The price at the end of the period.
- High: The highest price during the period.
- Low: The lowest price during the period.
Parts of a Candlestick:
- Body: The thick part, showing the range between open and close.
- Wicks (Shadows): Thin lines above and below, showing the high and low.
Example: A 1-hour Bitcoin candle with an open of $50,000, close of $51,000, high of $51,500, and low of $49,800 shows a price rise.
2. Green vs. Red Candles
Candles are color-coded to show price direction:
- Green (Bullish): The close is higher than the open, meaning the price went up.
- Red (Bearish): The close is lower than the open, meaning the price went down.
Example: A green Ethereum candle closing at $2,200 after opening at $2,000 signals a $200 gain in that period.

3. Candlestick Patterns
Groups of candles form patterns that hint at future price moves. Beginners should know two simple ones:
- Bullish Engulfing: A small red candle followed by a larger green one, suggesting a price rise.
- Bearish Engulfing: A small green candle followed by a larger red one, suggesting a price drop.
Tip: Practice spotting patterns on TradingView with free charts.
Identifying Trends on a Crypto Chart
Trends show the overall direction of a coin’s price, helping you decide whether to buy or hold.
1. Uptrend (Bullish)
An uptrend shows higher highs and higher lows, meaning the price is rising over time.
Example: If Bitcoin moves from $50,000 to $55,000 with small dips, it’s in an uptrend.
Tip: Buy during small dips in an uptrend to catch growth.
2. Downtrend (Bearish)
A downtrend shows lower highs and lower lows, meaning the price is falling.
Example: If Ethereum drops from $2,500 to $2,000, it’s in a downtrend.
Tip: Avoid buying in a strong downtrend; wait for signs of recovery.
3. Sideways Trend (Consolidation)
A sideways trend means the price stays flat, moving within a range without clear direction.
Example: Bitcoin trading between $49,000 and $51,000 for weeks is consolidating.
Tip: Use consolidation periods to research coins on CoinDesk.
Basic Indicators to Understand Charts
Indicators are tools that analyze price data to predict future moves. Beginners can start with these simple ones.
1. Moving Averages (MA)
A moving average smooths price data to show the average price over a period, like 50 or 200 days.
- Simple Moving Average (SMA): Averages prices equally.
- 50-Day vs. 200-Day MA: When the 50-day MA crosses above the 200-day, it’s a bullish signal (buy). Below is bearish (sell).
Example: If Bitcoin’s 50-day MA crosses above its 200-day MA, it may signal a price rise.
Tip: Add moving averages on TradingView charts.
2. Relative Strength Index (RSI)
RSI measures if a coin is overbought or oversold, ranging from 0 to 100.
- Above 70: Overbought, price may drop soon.
- Below 30: Oversold, price may rise soon.
Example: If Ethereum’s RSI is 75, it’s overbought, so wait before buying.
Tip: Check RSI on exchanges like Kraken.
3. Support and Resistance Levels
Support is a price level where a coin tends to stop falling, as buyers step in. Resistance is where it stops rising, as sellers sell.
Example: If Bitcoin keeps bouncing back at $48,000, that’s a support level. If it struggles to break $52,000, that’s resistance.
Tip: Draw support/resistance lines on TradingView to spot key levels.
How to Start Reading Crypto Charts
Ready to dive in? Follow these steps to read charts like a pro in 2025.
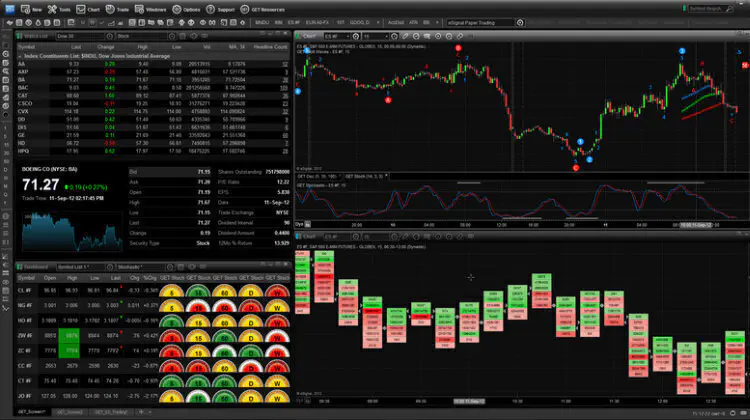
1. Choose a Charting Platform
Use a reliable platform to view and analyze crypto price charts.
Recommended Platforms:
- TradingView: Free, customizable charts with indicators.
- Coinbase: Simple charts for beginners.
- Binance: Advanced charts for trading.
How to Start: Sign up for TradingView and explore Bitcoin’s 1-day candlestick chart.
2. Focus on Major Coins
Start with established cryptocurrencies to practice chart reading.
Top Picks:
- Bitcoin (BTC): Most traded, with clear trends.
- Ethereum (ETH): Active market, good for learning.
Tip: Check coin data on CoinGecko before analyzing charts.
3. Practice with Simple Tools
Begin with candlesticks, moving averages, and support/resistance. Avoid complex indicators until you’re comfortable.
How to Do It:
- View a 1-week Bitcoin chart on TradingView.
- Add a 50-day SMA and look for bullish/bearish signals.
- Identify support levels where the price bounces.
Example: Spotting a bullish engulfing pattern on Ethereum’s chart could signal a good time to buy.
4. Secure Your Investments
Chart reading helps you invest, but security protects your funds.
How to Do It:
- Enable 2FA on exchanges like Kraken with Google Authenticator.
- Store crypto in a wallet like Trust Wallet or Ledger.
- Keep your seed phrase offline on paper, never digitally.
Example: In 2024, hacks cost millions. A Ledger wallet keeps your crypto safe.
5. Avoid Scams and Hype
Charts can be manipulated by hype or scams. Stay cautious to protect your investments.
How to Do It:
- Ignore X posts hyping coins with no fundamentals.
- Verify chart data on trusted platforms like CoinGecko.
- Learn scam tactics on Cointelegraph.
Example: A sudden price spike from a fake “Elon Musk” post could be a pump-and-dump scam.
Tips for Improving Your Chart Reading
To get better at reading crypto charts, follow these habits:
- Practice Regularly: Analyze Bitcoin’s chart daily on TradingView.
- Start Simple: Master candlesticks and moving averages before trying advanced tools.
- Learn from Experts: Read charting guides on CoinDesk.
- Join Communities: Get tips from Reddit’s r/cryptocurrency.
Risks of Relying on Charts
Charts are helpful but not perfect. Watch for these pitfalls:
- Market Manipulation: Whales can create fake patterns to trick investors.
- Overconfidence: Misreading patterns can lead to bad trades.
- Volatility: Sudden news can override chart signals. Learn how to trade without getting liquidated to manage these risks better.
Tip: Combine charts with research on Cointelegraph for better decisions.
Conclusion
Reading crypto price charts is a vital skill for beginners, helping you spot trends and make informed investments in 2025. Start with candlestick charts, learn basic indicators like moving averages, and practice on TradingView. Secure your funds with a Ledger wallet and stay updated via CoinDesk. With these steps, you’ll decode charts like a pro and navigate the crypto market with confidence!
Related Articles
Start on Binance Today
Create your free Binance account — trusted by 200M+ users worldwide. Low fees, high security, endless opportunities. Referral code: CPA_00DF3S8AFA.
Disclaimer: This post contains affiliate links. We may earn a commission if you sign up through our link, at no extra cost to you.