

If you’re new to cryptocurrency trading, crypto price charts can look like a confusing mess of lines and colors. But don’t worry—these charts are powerful tools for understanding market trends and making informed trades. This beginner-friendly tutorial will teach you how to read crypto price charts, from candlesticks to basic indicators, in simple terms. By the end, you’ll feel confident navigating charts on platforms like Coinbase or Binance.

Why Crypto Price Charts Matter
Price charts show how a cryptocurrency’s value changes over time, helping you spot trends, predict price movements, and decide when to buy or sell. Whether you’re trading Bitcoin, Ethereum, or altcoins, understanding charts is key to making smarter decisions. Charts are available on crypto exchanges, trading apps like TradingView, or market trackers like CoinGecko.
Types of Crypto Price Charts
There are several types of price charts, but these are the most common for beginners:
- Line Chart: A simple line showing the price over time. Great for spotting overall trends but lacks detail.
- Candlestick Chart: Shows price movements in time intervals (e.g., 1 hour, 1 day) with more detail. Most traders use this type.
- Bar Chart: Similar to candlesticks but less visual, showing price highs, lows, and closes.
For beginners, candlestick charts are the best place to start, so we’ll focus on those.
Understanding Candlestick Charts
Candlestick charts are the go-to for crypto traders because they pack a lot of information into a visual format. Each “candlestick” represents the price action for a specific time period (e.g., 1 hour, 1 day). Here’s how to read them.
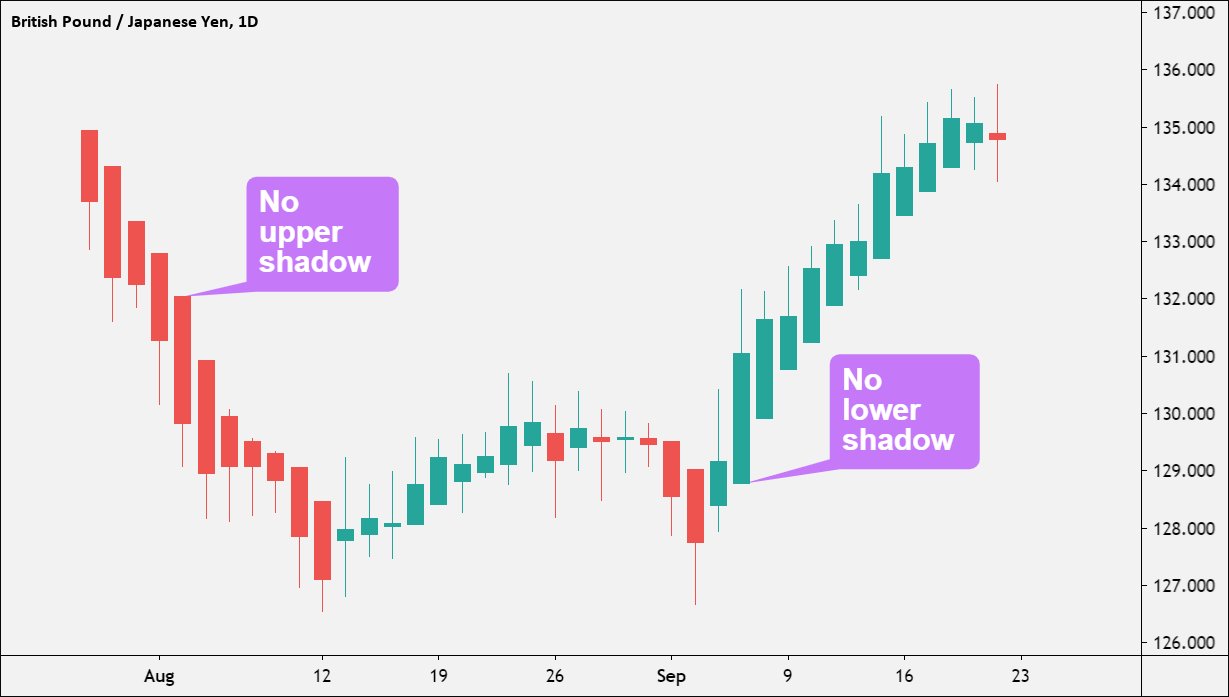
Parts of a Candlestick
Each candlestick has four key components:
- Body: The thick part showing the opening and closing prices.
- Wicks (Shadows): Thin lines above and below the body, showing the highest and lowest prices during the period.
- Green (Bullish) Candle: The price closed higher than it opened, indicating buying pressure.
- Red (Bearish) Candle: The price closed lower than it opened, indicating selling pressure.
For example, a green 1-hour candle means the price rose during that hour, while a red candle means it fell.
Timeframes
Candlesticks can represent different time periods, chosen based on your trading style:
- Short-Term (1m, 5m, 15m): Used by day traders watching minute-by-minute changes.
- Medium-Term (1h, 4h): Good for swing traders looking at daily trends.
- Long-Term (1d, 1w): Ideal for beginners or long-term investors checking daily or weekly trends.
Start with daily (1d) candles to keep things simple and avoid getting overwhelmed.
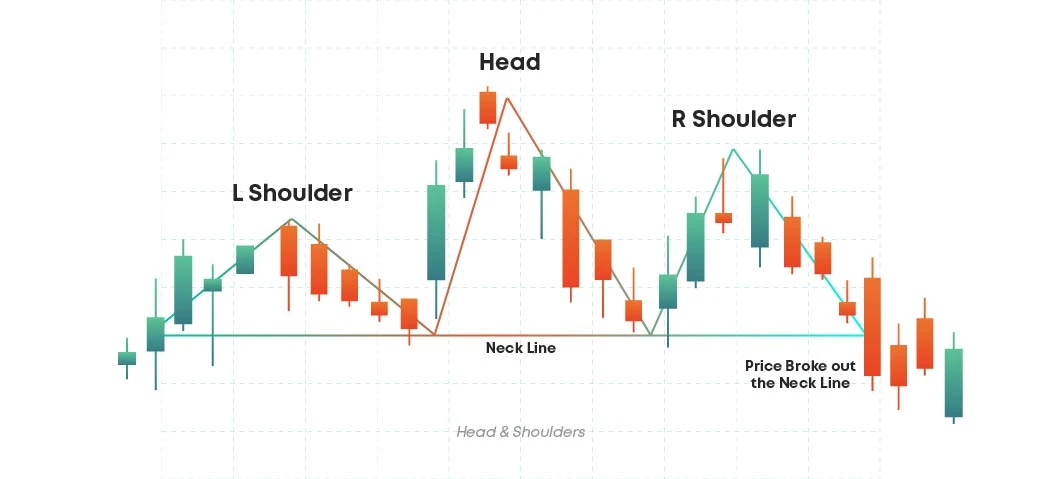
Key Patterns to Spot on Crypto Charts
Once you understand candlesticks, you can start spotting patterns that hint at future price movements. Here are three beginner-friendly patterns:
1. Uptrend (Bullish Trend)
An uptrend is when prices make higher highs and higher lows, forming a staircase-like pattern. This suggests strong buying interest and could be a good time to buy.
Example: A series of green candles with rising prices on Bitcoin’s daily chart.
2. Downtrend (Bearish Trend)
A downtrend shows lower highs and lower lows, indicating selling pressure. This might signal a time to sell or wait before buying.
Example: A sequence of red candles with falling prices on Ethereum’s 4-hour chart.
3. Support and Resistance Levels
Support is a price level where a crypto tends to stop falling, as buyers step in. Resistance is a level where the price struggles to rise further, as sellers take over.
- Support Example: Bitcoin keeps bouncing back from $30,000.
- Resistance Example: Ethereum struggles to break past $3,000.
These levels help you decide when to enter or exit a trade. Many charting platforms, like TradingView, let you draw support and resistance lines.

Basic Indicators for Beginners
Indicators are tools that analyze price data to provide insights. Here are two simple ones to start with:
1. Moving Averages (MA)
A moving average smooths out price data to show the overall trend. The two most common are:
- Simple Moving Average (SMA): Averages prices over a set period (e.g., 50 days).
- Exponential Moving Average (EMA): Gives more weight to recent prices, reacting faster to changes.
How to Use: When a shorter MA (e.g., 20-day) crosses above a longer MA (e.g., 50-day), it’s a bullish signal (buy). When it crosses below, it’s bearish (sell).
2. Relative Strength Index (RSI)
RSI measures whether a crypto is overbought or oversold, ranging from 0 to 100.
- Above 70: Overbought, meaning the price may drop soon.
- Below 30: Oversold, suggesting the price may rise.
How to Use: Use RSI to confirm trends. For example, an RSI below 30 during a downtrend might signal a buying opportunity.
Most exchanges, like Binance, include MA and RSI on their charts. You can also use TradingView for advanced charting tools.
How to Practice Reading Crypto Charts
Reading charts takes practice, but you don’t need to risk money right away. Try these steps:
- Use a Demo Account: Platforms like Binance offer demo trading to practice without real funds.
- Analyze Historical Charts: Look at past price data on CoinGecko to spot trends and patterns.
- Start with One Coin: Focus on Bitcoin or Ethereum to keep things simple.
- Track Your Observations: Note trends, support levels, or indicator signals to build confidence.
Tips for Reading Crypto Charts Safely
Charts are helpful, but they’re not foolproof. Follow these tips to use them wisely:
- Start Simple: Stick to candlesticks and basic indicators like MA or RSI before diving into complex tools.
- Combine with Research: Charts show price history, not the coin’s fundamentals. Read about a coin’s purpose on CoinDesk.
- Avoid Overtrading: Don’t make trades based on every chart signal—be patient.
- Beware of Scams: Ignore “signal groups” or paid chart predictions promising guaranteed profits.
- Practice Risk Management: Only trade with money you can afford to lose, as crypto is volatile.
What to Do After Learning to Read Charts
Once you’re comfortable with charts, take these next steps:
- Make a Small Trade: Test your skills with a small trade on Coinbase or Binance.
- Learn More Indicators: Explore tools like MACD or Bollinger Bands as you gain experience.
- Stay Updated: Follow market news on Cointelegraph to understand price movements.
- Join Communities: Discuss chart analysis with others on Reddit’s r/cryptocurrency.
Conclusion
Reading crypto price charts is a valuable skill that can boost your confidence as a trader. By mastering candlesticks, spotting trends, and using simple indicators like Moving Averages and RSI, you’ll be better equipped to navigate the crypto market. Start with daily charts, practice on platforms like TradingView, and combine your chart skills with research. Ready to try it? Open a chart on Binance or CoinGecko, and start decoding the crypto market today!